Project Overview
We are a student research team exploring the patterns of bushfires across Australia using satellite data. Our project uses digital tools to visualize how fire activity varies by time, location, and intensity, helping us better understand its environmental and social impact.
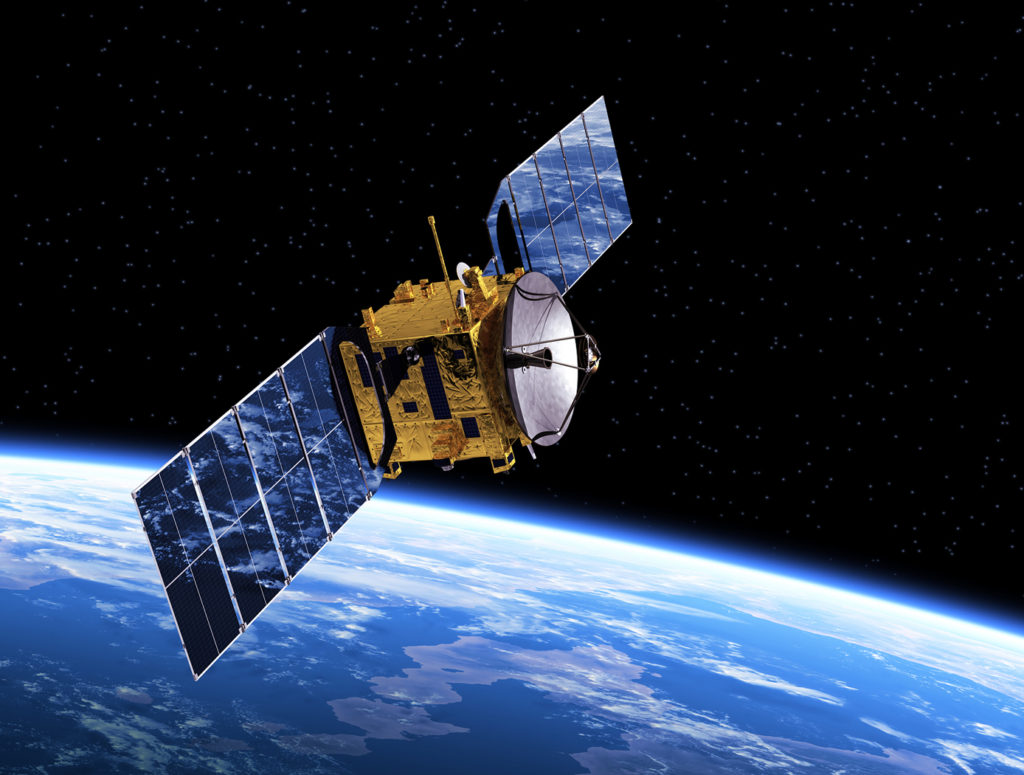
This site brings together interactive maps, timelines, and charts that highlight how space-based technology can help us monitor and respond to natural disasters. We aim to make this data easier to understand — not just for scientists, but for anyone curious about fire, climate, and the future of our planet.
Fires from Space: Our Research Focus
We use satellite data to explore when, where, and how bushfires spread across Australia. Our project highlights trends in fire frequency, intensity, and impact using interactive tools and visual analysis.
Satellite Fire Detection
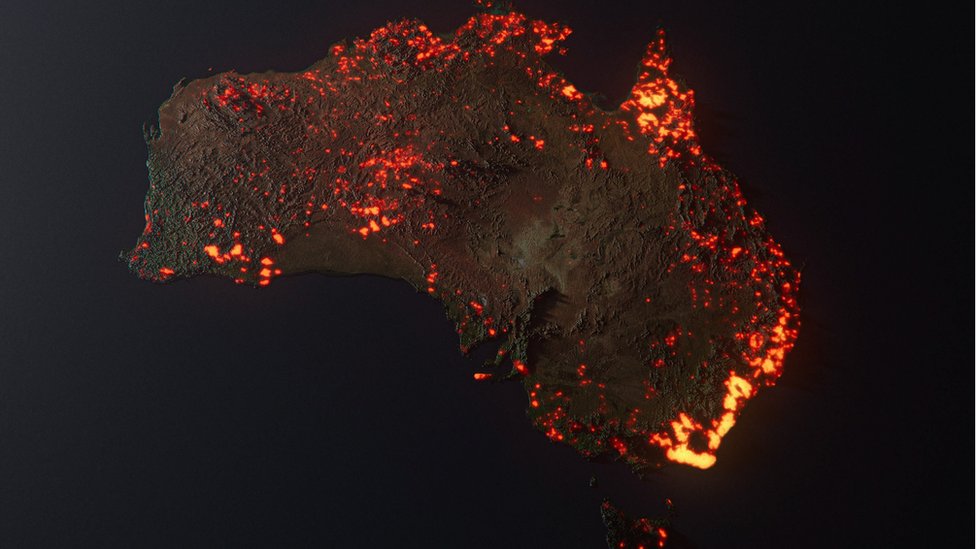
We used NASA and MODIS satellite data to identify fire activity across different parts of Australia.
This helps us see broad fire patterns over time and evaluate fire-prone regions.
Fire Patterns Over Time
We created timelines and bar charts that show how fire intensity and frequency change by region and time of year.
Understanding these trends helps researchers and communities better prepare for future fire risks.
Data Critique
This page breaks down the strengths and limits of our dataset, showing how fire data—like brightness and frequency—relates to geography and climate. It explains what the data reveals, what it leaves out, and how these insights can help shape safety policies and emergency responses.